Break-Even vs Profitability: Key Differences
Break-even analysis and profitability metrics are essential for understanding your startup's financial health. Here's the key takeaway:
Break-even analysis identifies the sales volume needed to cover costs, showing the point where you're no longer losing money.
Profitability metrics measure how efficiently your business generates profit beyond that point, focusing on long-term growth.
Why Both Matter:
Break-even helps you understand short-term survival by calculating the minimum sales needed to stay afloat.
Profitability evaluates long-term performance, showing how well your business can scale and generate returns.
Quick Overview:
Break-even: Immediate focus, calculates "no-loss" sales volume.
Profitability: Long-term focus, measures profit margins and efficiency.
Together, these tools guide pricing, cost management, and funding strategies while appealing to investors.
Cost, Revenue, Profit Equations and Break-Even Point
Break-Even Analysis Explained
Break-even analysis helps businesses pinpoint the exact sales volume needed to cover total costs. This calculation is invaluable for startups, offering insight into pricing, production, and growth strategies. Let’s break it down into its essential components and practical uses.
Key Components of Break-Even Analysis
To understand break-even analysis, you need to focus on three main elements:
Fixed costs: These are expenses that stay the same no matter how much you sell. Think of things like rent, salaries, insurance, or software subscriptions - they don't change with production levels.
Variable costs: These costs increase as sales or production grow. They include materials, shipping fees, payment processing charges, and commissions. The more you sell, the higher these costs climb.
Contribution margin: This measures how much each sale contributes toward covering fixed costs. To calculate it, subtract the variable cost per unit from the selling price per unit. Then, divide your total fixed costs by the contribution margin to find the break-even point in units.
Here’s an example: Imagine a startup with $10,000 in monthly fixed costs. If each product sale contributes $25 toward those costs, the business would need to sell 400 units to break even.
How Startups Use Break-Even Analysis
Startups rely on break-even analysis to make smarter, data-driven decisions. It’s especially useful when setting prices, launching new products, or comparing revenue streams. For instance, a SaaS company can calculate how many subscribers are needed to cover both fixed and variable costs.
Beyond pricing, this tool helps founders evaluate their overall business model. By knowing the break-even point for different scenarios, they can confidently choose the most viable strategies instead of relying on guesswork.
Impact on Financial Planning
Break-even analysis plays a critical role in financial planning, especially for early-stage startups. It provides clear insights into whether a business model is financially sound or needs adjustment [1][2]. This clarity not only reassures investors but also helps startups create a roadmap for long-term financial health and thorough due diligence preparation [1].
Profitability Metrics Explained
While a break-even analysis helps you identify when your business stops losing money, profitability metrics go a step further - they reveal the actual profit your startup is generating. These metrics offer a snapshot of your financial health and operational efficiency, giving you and potential investors a deeper understanding of how well your business is performing.
Main Profitability Metrics
Getting familiar with the key profitability metrics is essential for understanding your startup's revenue and financial performance. Each metric sheds light on different aspects of your business's ability to generate profit.
Gross profit measures the money your business earns from core operations after accounting for direct costs. It’s a way to evaluate how efficiently you’re delivering your product or service. For example, in a SaaS startup, this could be calculated as subscription revenue minus costs like hosting fees and customer support [3].
Gross profit margin expresses gross profit as a percentage of revenue. If your startup earns $100,000 in revenue and has $40,000 in direct costs, your gross profit margin would be 60%. A higher margin often signals better cost management and operational efficiency - both critical for long-term success [3].
Net profit represents what’s left after covering all expenses, including salaries, rent, taxes, and marketing. This metric is your bottom line, showing whether your business is truly profitable and capable of sustaining growth over time [3].
How Startups and Investors Use These Metrics
Profitability metrics aren’t just for internal use - they’re also vital tools for potential investors. They help evaluate whether your startup has the foundation to grow into a scalable, profitable business [3].
Gross profit offers a lens into the health of your operations. Software investors look for consistently high gross margins of 70% or greater, which suggest strong pricing strategies and efficient service delivery. Low margins, on the other hand, might point to inefficiencies, a commodity business, or challenges with pricing.
Gross profit margin is especially scrutinized during due diligence. It highlights your ability to control costs and maintain efficiency as your business scales. Investors want to see that your margins stay strong - or even improve - as revenue grows [3].
Net profit is the ultimate measure of profitability. It reflects how well your startup manages all aspects of its operations, from pricing and cost control to overall efficiency. For investors, a growing net profit signals a business poised for sustainable growth.
Pro Tip: Check out our recent article on The Rule of 40 and how investors use it to evaluate software startups.
Using Metrics for Growth and Scaling
Profitability metrics are more than just numbers - they’re a roadmap for scaling your business. They help you move from simply breaking even to achieving consistent, sustainable profitability [3].
A strong gross profit margin signals that your operations and pricing strategies are effective, laying the groundwork for scaling up. If your margins remain steady (or even improve) as you grow, it’s a sign that your business model can handle increased demand without a proportional rise in costs [4].
Net profit is your growth engine. Positive net profits allow you to reinvest in key areas like product development, hiring, and market expansion - all without having to rely solely on external funding [3][4].
While profitability metrics are essential, they work hand-in-hand with cash flow. Even a profitable business can struggle if cash flow issues prevent it from covering day-to-day expenses or seizing growth opportunities [4].
Other financial ratios, such as Return on Assets (ROA) and Return on Equity (ROE), become increasingly important as your startup scales. These metrics show how effectively your business is using its resources and capital to generate profit, providing further reassurance to investors [4].
Investors are particularly drawn to startups with scalable business models. They look for signs like improving unit economics, strong margins under growth pressure, and a clear upward trend in profitability. When combined with break-even analysis, profitability metrics offer a comprehensive view of both short-term stability and long-term potential.
Break-Even vs Profitability: Main Differences
Break-even analysis and profitability metrics serve distinct purposes in your startup's financial planning. Understanding how they differ is critical for making smart decisions about pricing, growth strategies, and securing investments. Each plays a unique role in shaping your financial roadmap.
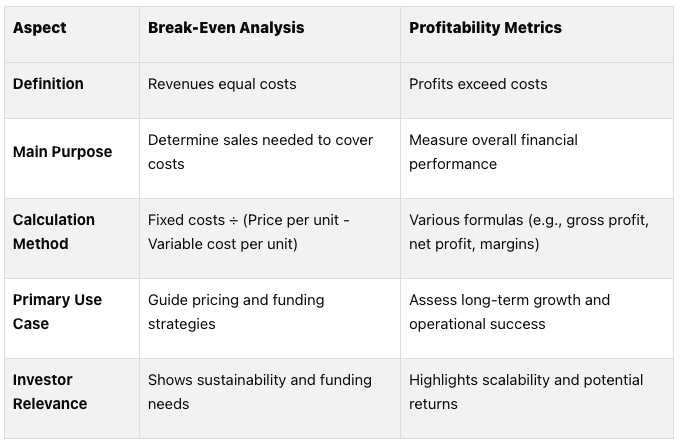
Side-by-Side Comparison of Break-Even and Profitability
At their core, these metrics provide different insights into your business's financial health. Break-even analysis pinpoints the exact sales volume needed to match total costs, essentially highlighting the "no-loss point" [1][5][6]. On the other hand, profitability metrics measure the actual profits generated after covering costs, offering a broader view of financial performance [1][5].
This comparison underscores how these tools address different financial questions, helping you balance immediate needs with long-term goals.
Short-Term vs Long-Term Focus
Break-even analysis answers the question: "What do we need to sell to cover our costs?" It’s a critical tool for understanding short-term sustainability, especially when calculating how long your runway is or how much funding you’ll need [1]. Profitability metrics, however, take a wider lens, evaluating how efficiently your business generates returns over time. While break-even focuses on immediate survival, profitability helps guide strategic decisions like market expansion, scaling operations, or investing in new products.
How Break-Even and Profitability Work Together
Despite their differences, these metrics work hand in hand to strengthen your financial planning. Break-even analysis provides the operational targets you need to hit to stay afloat. Once those targets are met, profitability metrics take over, revealing how well your business is performing beyond just breaking even. This combined approach is especially valuable during funding rounds when investors want to see both sustainability and growth potential clearly outlined.
How Investors Use These Metrics in Due Diligence
Investors take a close look at break-even points and profitability metrics to gauge both a startup's immediate financial health and its potential for long-term growth. These numbers play a key role in shaping funding decisions and overall investment strategies, offering insight into a company's financial foundation and growth trajectory.
Why Investors Like Allied Venture Partners Focus on These Metrics

Break-even analysis helps investors pinpoint when a startup will shift from burning cash to becoming self-sustaining (also known as “default alive”). For example, at Allied Ventures, which specializes in pre-seed, seed, and Series A investments, we use break-even projections to determine whether startups can reach sustainability within a reasonable timeframe based on their funding needs and available runway.
Profitability metrics, on the other hand, give us insight into how scalable and efficient a business model is likely to be. These metrics reveal whether a startup can generate meaningful returns and scalable unit economics as it grows, rather than just surviving. For tech companies in Allied's portfolio, figures like gross margin are especially important since they highlight how effectively the business can scale without proportionally increasing costs.
By combining these metrics, Allied syndicate investors get a clearer picture of both a company's stability and its potential for returns. This dual perspective is crucial for investors when weighing the risks of each investment across their portfolio.
Including These Metrics in Financial Models
Startups should integrate both break-even analysis and profitability projections into their financial models to build a compelling case for investors. Presenting multiple scenarios - such as varying growth rates, pricing strategies, and cost structures - demonstrates an understanding of financial dynamics and helps investors visualize how different factors might impact the company's future over the next two to four years.
For instance, financial models should clearly outline the break-even timeline under different assumptions. A SaaS company, for example, might model scenarios based on varying customer acquisition costs or churn rates. This allows investors to see how sensitive the business model is to key variables and assess the likelihood of achieving sustainability.
Profitability projections also need to be realistic and backed by solid market data. Investors will closely examine assumptions around gross margins, operating expenses, and revenue growth rates. Models that map out a clear path from break-even to profitability - highlighting specific milestones - are far more persuasive than those relying on overly optimistic projections.
The key here is context. Financial models should not just present numbers in isolation but show how break-even and profitability metrics evolve as the company scales. This approach provides investors with a clear roadmap for value creation.
Effect on Funding Rounds and Company Valuation
Both break-even and profitability metrics play a central role in shaping funding rounds and company valuations. Break-even analysis, for example, directly impacts how much funding a startup requires and when it should raise it. Startups that can demonstrate a clear path to break-even often find themselves in a stronger negotiating position. This metric allows investors to calculate the minimum investment needed to achieve sustainability, which can influence deal size and valuation.
Profitability metrics, however, tend to have an even greater impact on valuation. Startups with strong unit economics and a clear path to profitability are often valued higher because they pose lower risks and promise higher returns. Timing also matters - companies that can achieve profitability sooner often secure better terms, as they reduce the risk of requiring additional funding down the line.
For companies in growth stages, the balance between current profitability and future scaling potential becomes critical. Investors want assurance that a business can maintain or improve its profitability metrics as it grows, rather than sacrificing margins for expansion. Ultimately, the management team decides how much to increase or decrease growth in exchange for profitability. The key is having the optionality to do so, and this balance often determines whether a company can successfully secure larger funding rounds.
Let’s Recap (Summary)
Break-even analysis pinpoints the moment when a startup's revenue matches its costs, while profitability metrics measure how effectively it generates profit beyond that point. Together, these tools play distinct but complementary roles in shaping a startup's financial strategy.
The primary difference lies in their focus: break-even analysis serves as a short-term marker of survival, whereas profitability metrics highlight long-term growth and efficiency. Early-stage startups often rely on break-even analysis to estimate their runway and funding requirements. As they grow, metrics like gross margins and unit economics become critical for attracting investors and scaling operations. For instance, a startup might hit break-even relatively quickly but still need strong profitability metrics to secure additional funding.
These financial tools are not just internal planning aids - they’re also key to gaining investor trust. Investors use them to evaluate both immediate financial stability and future growth potential. By balancing these perspectives, startups can demonstrate both their ability to sustain operations in the short term and their potential for long-term success.
Startups that treat break-even points and profitability as interconnected milestones position themselves to attract funding, refine their strategies, and create lasting value. These metrics, when clearly communicated, serve as a roadmap for sustainable growth and strategic decision-making.
FAQs
How can startups use break-even analysis to set effective pricing strategies?
Startups can use break-even analysis to figure out the lowest price they need to charge to cover both fixed and variable costs. This tool helps pinpoint the sales volume required to avoid losses and start turning a profit. Knowing this threshold allows startups to set prices that balance competitiveness with their financial objectives.
Adjusting the break-even point regularly, especially as costs or market conditions shift, keeps pricing strategies on track. This practice not only supports financial health but also guides startups in making smarter decisions about expanding their business and positioning themselves in the market.
What is the difference between gross profit margin and net profit, and why do they matter to investors?
Gross profit margin zeroes in on how effectively a company produces and prices its products or services. It measures the profit left after subtracting direct costs, such as materials and labor (i.e., COGS). On the other hand, net profit takes a broader look, reflecting the overall profitability after factoring in all expenses, including operating costs, taxes, and interest.
Both metrics are essential for investors. Gross profit margin sheds light on how well a company manages production costs and operational efficiency. Meanwhile, net profit gives a complete snapshot of the company’s financial standing, showing its ability to generate profit after meeting all obligations. Together, these figures provide a clearer understanding of a business's performance and growth potential.
What role do break-even points and profitability metrics play in helping startups secure funding and attract investors?
Understanding a startup's break-even point and profitability metrics is key to assessing its financial health and growth prospects - especially when pitching to investors.
The break-even point reveals how quickly a business can cover its costs. A shorter time to break even suggests a lower risk and a faster route to generating profit, which naturally makes the company more attractive to potential investors.
Profitability metrics, meanwhile, go a step further by highlighting how efficiently a company operates and its ability to generate consistent profits over time. These figures reassure investors about the startup's financial stability and its potential for long-term success, making it easier to secure funding. Together, these metrics paint a compelling picture of a startup's financial foundation.
Popular Guides