Modelling Liquidation Preferences in Cap Tables
Liquidation preferences dictate how funds are distributed during a company’s exit, determining who gets paid first and how much. These terms are critical for founders and investors because they significantly impact payouts. Here’s a quick breakdown:
Liquidation preferences prioritize payouts to preferred shareholders before common shareholders.
Types include non-participating (investors choose between their preference or converting to common stock) and participating (investors get their preference plus a share of remaining proceeds).
Cap tables track ownership, share classes, and liquidation terms, making them essential for modeling payouts.
Modeling scenarios - like low or high exit values - helps founders and investors understand how preferences impact returns.
Accurate modeling ensures fair expectations, smarter negotiations, and clarity during exits. The article dives into key concepts, examples, and best practices for building and maintaining precise cap tables.
Modelling a cap table & distribution waterfall in Excel
Main Liquidation Preference Types
Grasping the different types of liquidation preferences is essential for accurately modeling payout scenarios. Each structure plays a crucial role in determining how proceeds are distributed within your cap table. Here's a closer look at how these preferences impact investor payouts.
Non-Participating vs. Participating Preferences
The key distinction between non-participating and participating preferences lies in how investors receive their returns during an exit.
Non-participating preferences give investors a choice: they can either take their liquidation preference amount or convert their preferred shares into common stock and claim their share of the proceeds - whichever option yields more. This structure often benefits founders, as investors must choose one path.
Participating preferences, however, allow investors to "double dip." First, they receive their liquidation preference amount. Then, they participate in the remaining proceeds alongside common shareholders. This structure significantly reduces payouts for founders and employees.
To see how these structures work, let’s consider a 2023 example from Carta. Imagine a company sells for US$10 million:
With non-participating preferences, investors compare their liquidation preference (e.g., US$3 million) to their pro-rata share of the US$10 million exit. If they own 30% of the company on a converted basis, they would choose the higher amount - US$3 million in this case.
With participating preferences, investors first take their US$3 million liquidation preference. Then, they claim 30% of the remaining US$7 million, adding another US$2.1 million for a total of US$5.1 million.
The market overwhelmingly leans toward non-participating preferences. In 2024, 97% of non-participating shares carried a 1x multiple [2].
Next, let’s explore how different rounds are treated under pari passu and stacked structures.
Pari Passu vs. Stacked Preferences
When a company raises multiple funding rounds, creating various classes of preferred stock, the order of payouts becomes critical. This is where pari passu and stacked preferences come into play.
Pari passu preferences treat all preferred shareholders equally, regardless of when they invested. If the company’s proceeds are insufficient to satisfy all liquidation preferences, the available funds are distributed proportionally among all preferred shareholders. This approach tends to favor founders, as it limits early payouts to later investors.
Stacked preferences, on the other hand, create a hierarchy. Later investors - such as those in Series B or C - are paid first, followed by earlier investors like Series A, and finally common shareholders. This structure can leave founders with little to no payout, even in moderately successful exits.
Here’s an example: A company with US$5 million in Series A preferred stock and US$10 million in Series B preferred stock (both with 1x non-participating preferences) exits for US$12 million.
Under pari passu, Series A and Series B investors share the proceeds proportionally. Series A receives US$4 million, and Series B gets US$8 million, leaving nothing for common shareholders.
Under stacked preferences, Series B investors take their full US$10 million first. Series A investors then receive the remaining US$2 million, again leaving nothing for common shareholders.
Now, let’s examine how liquidation multiples further impact investor returns.
Liquidation Multiples
Liquidation multiples define how much investors are entitled to receive relative to their original investment before common shareholders see any proceeds. While a 1x multiple is the norm, higher multiples provide investors with added protection during challenging exits.
"A liquidation multiple is the multiple of the investor's initial investment that they are entitled to before ordinary shareholders receive any proceeds." – HSBC Innovation Banking [1]
The impact of these multiples becomes clear in exit scenarios. Using another 2023 example from Carta, let’s analyze an investor holding one million Series A preferred shares with an Original Issue Price of US$1.00:
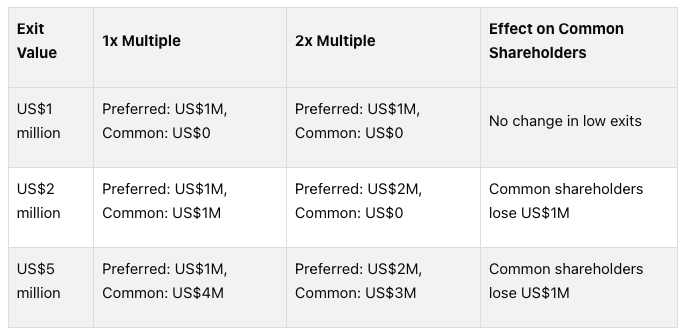
Higher multiples become especially relevant in tough market conditions. Investors often negotiate for 2x or higher multiples to safeguard their returns [3]. However, these higher multiples come at a steep cost to other equity holders.
As Kristoffer Warren from Carta points out:
"Similar to stacked preferences, liquidation multipliers give investors additional protection against a company's downside exit scenarios. But as shown above, this comes at the expense of other equity holders."
In 2024, 84% of participating preference shares carried a 1x multiple [3], showing that despite the added participation rights, most investors stick with the standard 1x multiple.
When modeling liquidation preferences, it’s critical to understand how multiples interact with participation rights. For example, a 2x participating preference can drastically reduce the equity available to founders compared to a 1x non-participating structure.
How to Model Liquidation Preferences in Cap Tables
Creating an accurate cap table requires organizing all equity data into a well-structured framework. This ensures clarity and helps stakeholders navigate even the most complex scenarios.
Setting Up a Cap Table
Start by including the basics in your cap table: shareholder names, share classes, share counts, ownership percentages, and the original issue price of shares.
To go beyond the basics, incorporate columns that detail liquidation terms. Include the liquidation preference multiple (e.g., 1x, 2x), participation rights (participating or non-participating), seniority structure (pari passu or stacked), and any participation caps. These elements are critical when simulating different exit scenarios.
Don’t overlook factors like anti-dilution provisions and founder carve-outs. Many founders oversimplify their cap tables, which can lead to errors during liquidity events. Another essential detail to track is the conversion ratio for each preferred share class. This allows for automatic adjustments when converting preferred shares to common stock yields higher returns for investors.
Once your cap table is structured, input the specific liquidation terms for each share class.
Adding Liquidation Preferences
With your cap table framework ready, the next step is to input detailed liquidation terms for each investor group. Precision here is crucial, as even small mistakes can lead to major miscalculations down the line.
For each preferred share class, specify key details:
Participation type: Whether investors are participating or non-participating.
Liquidation multiple: For example, 1x or 2x.
Seniority structure: Whether the structure is pari passu (equal footing) or stacked (hierarchical payout).
Participation caps: If applicable, limits on how much participating investors can receive.
While most modern deals use pari passu structures, older agreements might include stacked preferences, which prioritize payouts to later investment rounds. Your cap table must accurately reflect these distinctions.
Once the liquidation terms are defined, you’re ready to build a waterfall model, which maps out how funds will be distributed.
Building a Waterfall Model
A well-constructed waterfall model translates ownership data and liquidation terms into clear payout scenarios.
Start by calculating each investor’s liquidation preference amount. Multiply their original investment by their liquidation multiple to determine their minimum payout. For instance, a Series A investor who invested $2 million with a 1.5x preference would have a liquidation preference of $3 million.
Next, conduct a conversion analysis. For each preferred share class, calculate what investors would receive if they converted their shares to common stock and participated pro-rata in the exit proceeds. This ensures investors can see which option maximizes their returns.
Apply the seniority structure to allocate funds. Pari passu shares divide proceeds proportionally, while stacked preferences prioritize payouts to certain rounds before others. After satisfying liquidation preferences, distribute any remaining proceeds. Non-participating investors stop at their liquidation preference, while participating investors continue to receive their pro-rata share of what’s left, alongside common shareholders.
Adjust ownership percentages whenever some investors convert to common stock while others remain preferred. For example, if Series A converts but Series B stays as preferred, the common share pool expands, which affects everyone’s pro-rata share.
Your waterfall model should integrate data from both the cap table and legal documents, like the company’s operating agreement or certificate of incorporation. These documents outline the formal rules for payouts, so your model must align with them.
Finally, create reports that clearly show payouts for each stakeholder under various exit scenarios. Tailor these reports for different audiences - investors want to see their specific returns, while founders need a broader view, including the impact on employee equity pools. Test the model with edge cases, such as exit values equal to total preferences or scenarios involving participation caps, to ensure accuracy and reliability.

Testing Different Liquidation Scenarios
Once your waterfall model is ready, it’s time to simulate various exit outcomes. This helps you understand how different exit values and liquidation terms impact returns for all stakeholders. By testing multiple scenarios, founders and investors can gain a clearer picture of how these terms influence payouts and make more informed decisions.
Modeling Different Liquidation Multiples
Using your waterfall model as a foundation, you can experiment with different liquidation multiples to see how small adjustments affect payout distributions. Liquidation multiples can have a significant impact, especially in lower exit scenarios. Start by modeling common multiples like 1x, 1.5x, and 2x preferences.
Here’s an example: Imagine a company that raised $5 million in Series A funding. In a $10 million exit with a 1x preference, Series A investors would claim their $5 million preference, leaving the remaining $5 million for other stakeholders. However, with a 2x preference, the Series A investors would take the entire $10 million, leaving nothing for common shareholders. In higher exit scenarios, such as $50 million, converting to common stock often provides better returns than sticking with the liquidation preference.
To make this process more efficient, build models that automatically calculate both the liquidation preference payout and the conversion to common stock payout for each multiple. For instance, if a Series A investor holds 20% ownership and a 1.5x preference on a $3 million investment, conversion becomes more attractive when the exit value exceeds $22.5 million. These models help pinpoint the exact breakeven point where conversion offers a better return.
Testing Exit Scenarios
Testing various exit scenarios can reveal how liquidation preferences shape outcomes under different conditions. Focus on low, medium, and high exit scenarios to see how distributions shift.
Low exit scenarios (1x–3x total capital): In these cases, liquidation preferences dominate, often leaving little or nothing for common shareholders.
Medium exit scenarios (3x–8x total capital): These scenarios create a mix of outcomes, where some preferred investors convert to common stock while others stick with their preferences. This can alter pro-rata calculations and lead to more complex dynamics.
High exit scenarios (above 8x total capital): Here, most preferred investors typically convert to common stock, maximizing their returns. However, participating preferred shares may still claim both their preference and pro-rata shares, which can significantly impact overall distributions.
It’s also useful to test edge cases, such as when the total exit value matches the sum of all liquidation preferences. Document these situations and analyze how participation caps and seniority structures interact under such conditions.
Using Tables for Comparison
To simplify these complex calculations, use summary tables to provide a clear, side-by-side comparison of outcomes. Tables make it easy to visualize how different liquidation terms affect payouts for investors, founders, and employees.
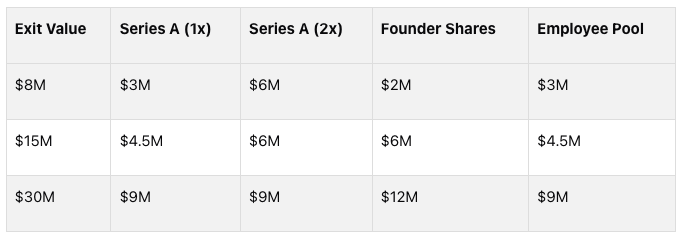
For example, in an $8 million exit, the 2x preference doubles the Series A payout while cutting the founder’s returns in half. But in a $30 million exit, both 1x and 2x preferences result in the same distribution since the investor converts to common stock.
You can also create separate tables for participating versus non-participating preferences. These comparisons often highlight how participating preferences can disproportionately benefit investors in higher exits, sometimes at the expense of founders and employees. Additionally, sensitivity analysis tables can show how even small changes in exit value affect distributions around critical breakeven points.
Lastly, consider building tables to compare different seniority structures in identical exit scenarios. For instance, pari passu structures tend to favor earlier investors in moderate exits, while stacked preferences often benefit later investors. These comparisons give founders a better understanding of how liquidation terms from each funding round can influence long-term outcomes.
Common Mistakes and Best Practices
Even the most seasoned founders and investors can make mistakes when modeling liquidation preferences, leading to major discrepancies during exits. To avoid these pitfalls, it’s crucial to understand common errors and adopt strategies that ensure your cap table remains accurate and transparent.
Avoiding Common Mistakes
One of the most frequent mistakes involves misunderstanding participation caps in waterfall calculations. Many founders misinterpret these caps, which limit further pro-rata payments after reaching a specified multiple. For example, if a Series A investor has a 1x preference with a 2x participation cap on a $2 million investment, they receive their $2 million preference plus their share of remaining proceeds - up to $4 million total. Beyond that, they convert to common stock if it offers better returns.
Another common error is ignoring anti-dilution provisions during new funding rounds. Down rounds or flat rounds can trigger weighted average anti-dilution adjustments, significantly altering ownership percentages and liquidation preferences. Without automatic recalculations, these adjustments can skew ownership stakes and preference amounts. Ensure your model accounts for these changes automatically to avoid distortions.
Improperly stacking liquidation preferences is another critical issue. Confusion often arises when founders apply pari passu terms instead of stacked structures outlined in the term sheet. This becomes especially problematic when Series B investors have different liquidation multiples than Series A investors. Since seniority impacts payment order and amounts, it’s essential to model these preferences accurately.
Overlooking conversion mechanics can also lead to errors. Preferred shareholders may need to decide between converting to common stock or claiming their liquidation preference. This requires comparing payouts under both scenarios for each investor class. A good model should automatically determine which option yields the best return.
Keeping Cap Tables Accurate Over Time
Beyond avoiding mistakes, maintaining an accurate and up-to-date cap table is critical to preventing future errors. As companies issue equity, grant options, or complete funding rounds, their cap tables evolve. Regular updates are essential to avoid compounding errors over time. Consider scheduling quarterly reviews to reconcile your cap table with legal documents, board resolutions, and option grant records.
Convertible notes and SAFEs add another layer of complexity. These instruments often convert during funding rounds using formulas based on valuation caps, discount rates, and other provisions. Create dedicated tracking sheets for all outstanding convertible securities, detailing their conversion terms and trigger events. Once they convert, update the cap table to reflect the new preferred shares and their associated preferences.
Option pool expansions also require careful modeling. Investors often demand that option pools come out of founder ownership rather than diluting all shareholders equally. This impacts pre-money valuations and can shift liquidation preference amounts. Always assess how option pool changes will affect founder dilution and investor returns before finalizing term sheets.
Employee option exercises add further complexity. When employees exercise options at varying strike prices over time, new common shares are created, which participate in liquidation distributions. Maintain detailed records of exercise dates, strike prices, and vesting schedules to ensure accurate modeling of employee payouts during exits.
Version control is another best practice as your cap table grows more complex. Save dated versions of your cap table after significant updates and document the reasons behind each change. This creates an audit trail, making it easier to identify and resolve discrepancies.
Maintaining Clear Communication
Technical accuracy is only part of the equation - clear communication is equally important to ensure all stakeholders understand the cap table’s evolution and implications.
Transparent documentation helps prevent misunderstandings that could derail exit negotiations. Create summary sheets that explain liquidation preferences, participation rights, and anti-dilution provisions in plain language. Use specific examples to illustrate how these terms work in different scenarios.
Regular stakeholder updates are another key practice. Share quarterly cap table summaries with key investors and advisors, highlighting any changes since the last update. This proactive approach not only builds trust but also helps catch errors early.
Using consistent terminology across all documents eliminates confusion. Clearly define terms like "liquidation preference", "participation cap", and "anti-dilution" to ensure everyone is on the same page. At Allied Venture Partners, we emphasize the importance of clarity during fundraising, as misunderstandings about liquidation terms can complicate future funding rounds and exits.
When preparing for new funding rounds, provide detailed cap table scenarios that show how proposed terms will impact existing stakeholders. Include pre-money and post-money ownership percentages, as well as liquidation preference amounts for each investor class. This transparency can facilitate smoother negotiations and help investors better understand dilution impacts.
Finally, coordinate legal reviews to ensure your cap table aligns with legal documents. Regularly verify that your calculations match the terms outlined in charters and investor agreements. Discrepancies between your cap table and legal records can create serious issues during due diligence or exits.
Establish clear protocols for managing cap table updates. Limit editing access to one or two trusted individuals to reduce the risk of errors or unauthorized changes. For complex updates, such as anti-dilution adjustments or conversion calculations, seek approval from legal counsel before making changes. This ensures accuracy and maintains stakeholder confidence.
Conclusion
Understanding liquidation preference modeling is a must for both founders and investors. These financial tools are intricate, requiring precision, close attention to detail, and a solid grasp of how different preference structures can influence returns during exit events.
Key Takeaways
To build accurate models, it’s critical to understand the differences between non-participating and participating preferences, pari passu and stacked structures, and liquidation multiples. Each of these structures creates unique payout scenarios, significantly shaping how proceeds are distributed during an acquisition or IPO.
An effective waterfall model should incorporate conversion mechanics, anti-dilution provisions, and participation caps. The best models automate decisions, such as determining whether preferred shareholders should convert to common stock or claim their liquidation preference. This automation minimizes errors and ensures accurate calculations - critical during high-stakes exit negotiations.
Testing various exit scenarios is equally important. By modeling outcomes ranging from modest exits to billion-dollar valuations, companies can better understand how liquidation multiples and valuations impact stakeholder returns. This preparation proves invaluable during fundraising discussions and exit planning.
While technical accuracy in cap table modeling is essential, clear communication and proper documentation are just as important. Regular updates, version control, and collaboration with legal counsel help maintain accurate and compliant cap tables. These practices create a foundation for smarter cap table strategies.
Next Steps for Founders and Investors
Start by auditing your current cap table to identify any gaps in liquidation preference modeling. Review waterfall calculations to ensure they account for participation caps, anti-dilution adjustments, and conversion mechanics. If your model doesn’t include these features, consider upgrading it before your next funding round.
Set up quarterly cap table reviews to reconcile data with legal documents, option grant records, and board resolutions. Regular reviews help catch and correct errors early.
For founders gearing up for a funding round, model the impact of proposed liquidation preference terms on existing stakeholders. Scenario analyses showing potential returns under different exit valuations can strengthen your position in negotiations with investors.
Investors should also ensure their portfolio companies maintain accurate cap tables and strong preference models. Providing resources like templates or guidance can help founders avoid common mistakes and foster transparency among stakeholders.
Allied Venture Partners collaborates with early-stage companies to ensure their cap table management meets high standards throughout the fundraising process. Using tools like the Cap Table Modeling Tool helps founders understand their current cap table and model next round dilution.
With a global network of angel investors and VCs, we strive to bring deep expertise in structuring liquidation preferences that balance the interests of both investors and founders. Working with experienced networks like this can provide valuable support and help avoid costly errors during critical funding rounds.
Investing time in building precise liquidation preference models pays off across every stage of a company’s journey - from early fundraising to eventual exit. Mastering these fundamentals leads to smoother fundraising, better communication with stakeholders, and stronger outcomes for everyone involved.
FAQs
What are liquidation preferences, and how do they affect payouts for founders and common shareholders during an exit?
Liquidation preferences outline how the proceeds from a company’s exit (like a sale or merger) are divided among its shareholders. They grant preferred shareholders the right to be paid first, typically ensuring they recover their initial investment (or sometimes a multiple of it) before any funds go to common shareholders, such as founders.
This hierarchy can have a big impact on what founders and common shareholders ultimately receive, particularly in cases where the exit valuation is on the lower side. If the payout owed to preferred shareholders exceeds the exit valuation or includes features like participation rights, common shareholders might end up with a much smaller share - or even nothing at all. Grasping these terms is essential for accurately modeling cap tables and predicting potential outcomes in exit scenarios.
What is the difference between pari passu and stacked liquidation preferences, and how do they influence payout order in multiple funding rounds?
Pari passu liquidation preferences ensure that investors within the same preference group are treated equally during a liquidation event. This means payouts are distributed proportionally and simultaneously among all investors in that group, without consideration for when they invested or any differences in their specific agreements.
On the other hand, stacked preferences create a tiered payout structure. Here, investors in higher tiers - often referred to as senior preferences - are paid in full before any funds are distributed to those in lower tiers, known as junior preferences. This prioritization can delay or even reduce payouts for junior investors, as senior investors take precedence.
Choosing between these structures has a major influence on how funds are allocated during liquidation, shaping both the returns investors receive and the extent to which founders retain equity.
How can founders ensure their cap tables accurately reflect liquidation preferences and avoid common mistakes?
To keep cap tables precise and account for all liquidation preferences, founders need to fully grasp key terms like participating and non-participating preferences, along with how these affect payout structures. Accurately modeling these terms ensures the rights of investors are correctly reflected.
By leveraging reliable cap table tools, founders can run simulations for different exit scenarios. This helps confirm payout calculations and spot any potential problems early. Regular reviews and updates to the cap table are crucial, especially when new funding rounds or ownership shifts take place. Staying on top of these details prevents errors, such as miscalculations or missed terms, and reduces the risk of misaligned expectations or disputes.
Popular Guides